Using Artificial Intelligence to improve forecasts - when the economic outlook looks choppy, how can you bring some clarity and profit from your data?
Plenty of discussion with regard to the current global, national and local economic environment. The causes of which are much discussed and many have a different opinion.
What’s clear is that we are all entering a (another ☺) period of uncertainty. Uncertainty is something that most businesses don’t enjoy. Many businesses become more risk averse, they reduce investment and find it difficult to take advantage of opportunities. Others double-down on core activity and tread water hoping for better times ahead. Some, take advantage of competitor fallibility and pursue positive market growth strategies that make them significantly stronger as the cycle turns in the medium term.
Risk is always difficult to manage and mitigate for. I was lucky enough to attend my first Cog X https://www.cogxfestival.com/ in 2018 at the Tobacco Dock. I remember listening to a presentation about AI being about the reduction of risk.. Whether that is autonomous cars, credit card fraud, customer churn or improving supply operations. I remember at the time thinking how forecasting was a significant risk in many businesses.
So how do you go about predicting the unpredictable with Artificial Intelligence?
One of the pillars of reducing risk is the ability for any business to be able to forecast with accuracy and precision.
Accurate means being correct, precise means being consistent.
What you want is a tight grouping of accurate predictions. If you are not accurate, then your predictions may be precise, but wrong. There is a good dartboard analogy/example that explains what you are trying to achieve, imagine each dart is a Category prediction in your business.
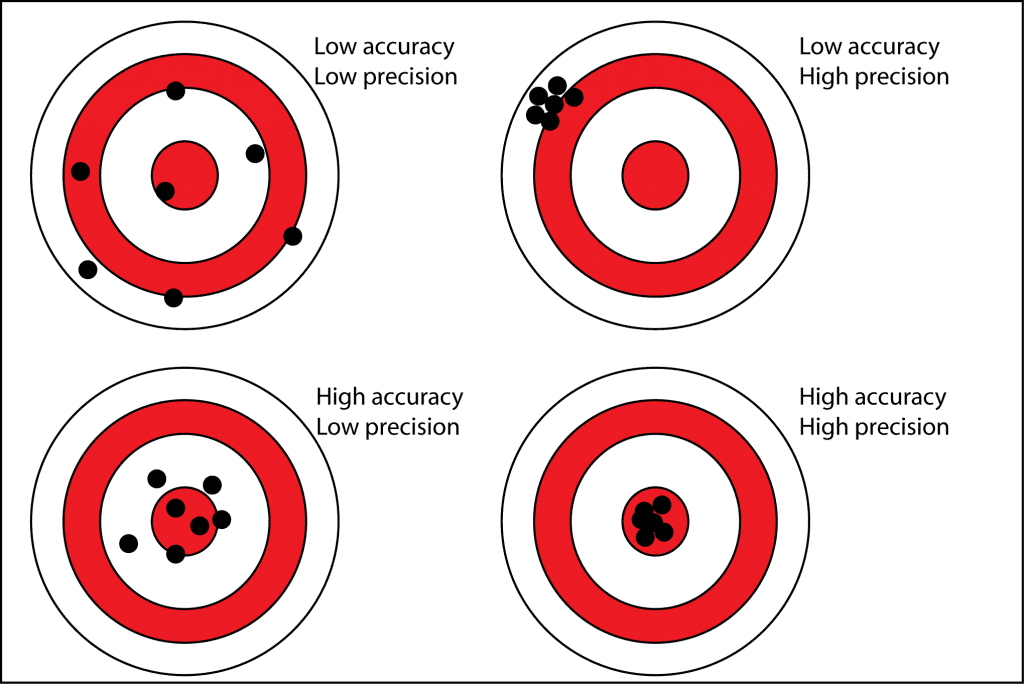
Of course, the more consistent your inaccuracy is, the easier it is to interpret; however we’re sitting much more on the side of isn’t it better to get your forecasts consistently correct?
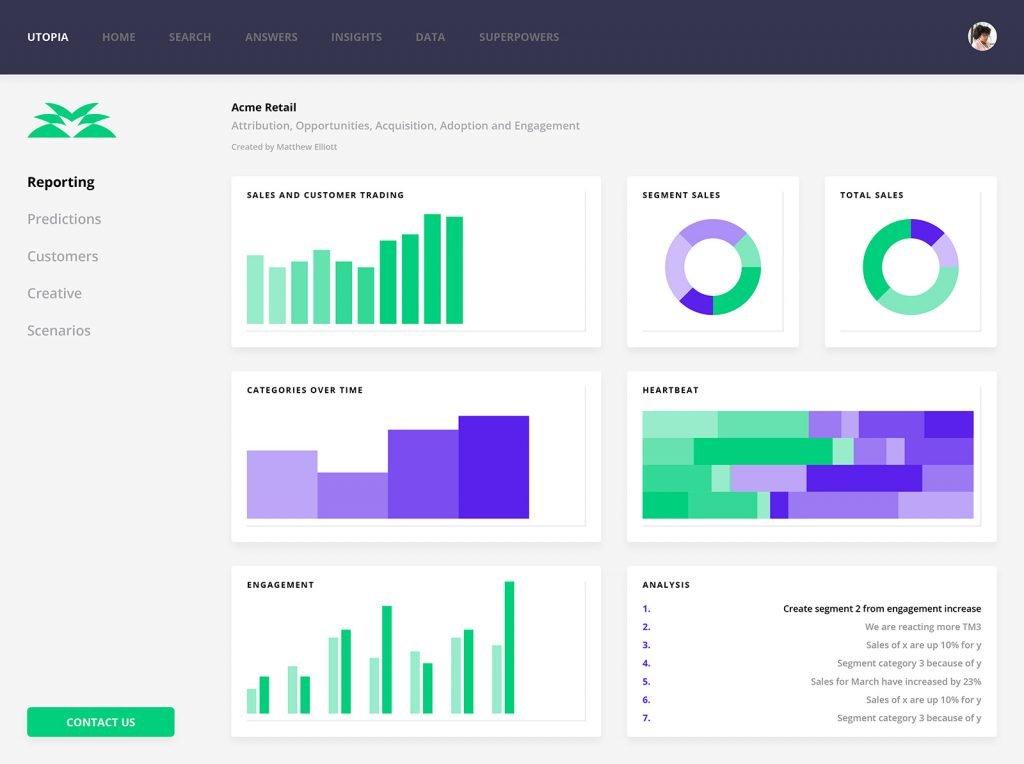
There are several ways that we have approached this over recent months. The great thing is, most brands already have the data they need to significantly improve their forecasting.
If we accept that from a forecasting objective, many businesses and functions have optimisations they can make, this becomes an area that can add significant value. Not only in terms of time spent, but also, with trustworthy forecasts where investment decisions can be made. To get there, your stakeholders need to trust the outputs. You need to trust the outputs.
If you want to profit from data, forecasting is a great place to start.
Our key objective is trustworthy, precise and accurate forecasting for sales revenue at different levels within the business. We’re going to look at this problem by considering data sources, the models/algos we need and the outputs of what would be useful.

Data sources
Forecasting relies on having a regular dataset that includes the regularity of data that you want to forecast on. So, if you intend to forecast monthly, you need monthly data. But there can be an issue with that. Different algos work in different ways, so you need to have a think about what’s important. If we aim to achieve a more accurate forecast, we probably need more granular data than we are forecasting for.
If we wish to do monthly forecasts, we should be harvesting weekly or daily data. The reason for this is sound, if you were asking a colleague to forecast, the monthly numbers themselves wouldn’t be that useful for accuracy. They would normally ask what is that number made up of, what is the context. So, to be successful with machine learning, it makes sense for us to supply more context. Therefore, we should feed more granular data.
Consider also narrative data, so sometimes stock is sold on promotion, or for services there is an acceleration or deceleration of requirement. Having this kind of narrative data available as well as the pure numbers makes a difference. In the same way as we humans like to talk around context, so the machines like to know. The secret is giving them the right info for them to understand the true impact. This doesn’t have to be a rival to Leo Tolstoy by any means. It can be ‘we ran a promotion’ ‘large customer order pulled forward’ ‘price increases’ ‘out of stocks’. Eventually, this can become more systematic, but that’s not necessary to begin with.

Slave to the Algorithm
So how do you go about choosing the right algo and making sure stakeholders are going to start to trust the output.
How to weigh up the different choices, how to make a short list?
When selecting a model, the quality of the model’s results is a critical consideration. You’ll want to prioritise algorithms that will help you achieve that goal. Classification and regression are two of the most commonly dealt with prediction problems. Accuracy, Precision, and Recall are used to assess classification problems (for example, predicting whether customers will subscribe to this product or not). Regression problems (for example, predicting the quantity of an SKU to be sold in the future) are assessed in terms of error rates such as Mean-squared error.
Different metrics may be beneficial for analysing the model’s output depending on the problem. Keep in mind that not all metrics are appropriate in all situations. When working with unbalanced datasets, for example, accuracy isn’t acceptable. Before we can begin the model selection process, we must first choose a good metric (or combination of metrics) to evaluate your model’s performance.
How to make a selection
In numerous instances, being able to explain a model’s outcomes is critical. Unfortunately, many algorithms operate like black boxes, and the outcomes, no matter how wonderful they are, are difficult to explain.
In some cases, the absence of explanation could be a deal-breaker.
When explainability is a concern, Linear Regression and Decision Trees are good options. Neural networks, on the other hand, are a different story.
Before choosing a good contender, it’s crucial to know how easy it is to interpret the results of each model.
Each problem requires a different approach and in most cases there are 2-4 architectures/models that would work the best, you try to maximise all of them and compare for the best results.
How to make initial judgements on results
For initial judgments, what one should do is try exploratory analysis on the data before selecting the features and get a clear understanding of how each individual feature makes an impact, also you can check how the distribution of the data is linear, nonlinear, etc. This helps you select the best features which will yield in the best outcomes which is the final goal, also once you start to get some results you can use various scoring methods to understand how well your algo is performing some metrics are f1-score, R2 square, MSE, RMSE, accuracy score, etc. Depending on the problem you are solving, the scoring methodologies will change.
How to optimise the model
There are multiple ways on optimising the model, one can be to do data enrichment, i.e. to add more data sources which can be sourced from publicly available dataset or from internal data which will have a direct relationship with the existing data, for Ex: if we have sales data adding the promotion (internal), weather (public), location, etc. Can highly improve the data and help provide better metrics and context of the patterns, the other approach can be to use grid search and hyperparameter tuning which executes a bunch of parameter values on the algorithm to find the best parameters which in return provides better results.
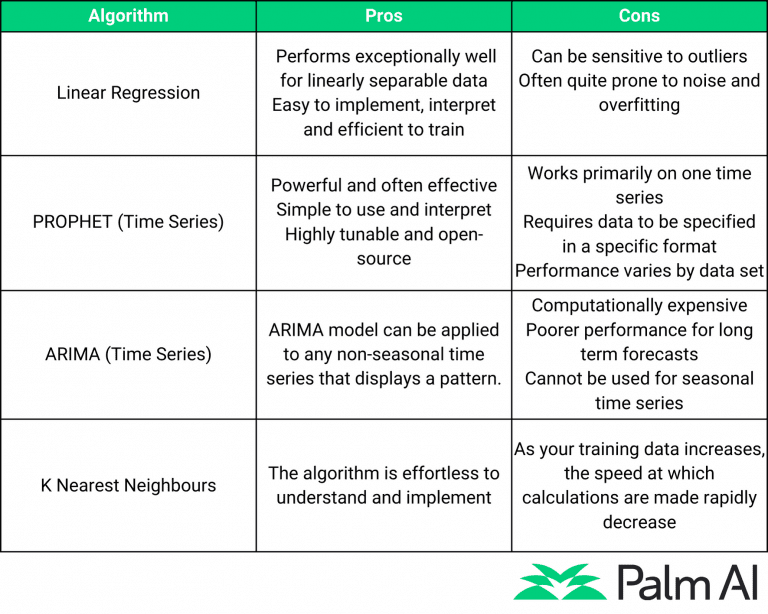
How do each of these sample algos work and what use case may these be best for? Here’s a handy, shareable summary table!
We spend so much time talking about, thinking about, reviewing and presenting our forecasts, but we never really seem to get them right.
Says: Absolutely Everyone Tweet
Outputs
Forecasts tend to come in a range of most likely occurrence. However, most people like a more defined number, especially if they are trying to forecast over a range of products or services. It becomes quite difficult to articulate what your forecast is if you have a wide range.
With any forecast output, stakeholders will want to know context. The context that you give them will help their judgement in how they weigh the output.
Forecasting with context is a highly valuable asset.
Is it time to update your approach to see if you can realise the benefits over the next period? None of us may know exactly what will happen, but we can all be better prepared to profit from the data we already have.